
Jym’s class has been working on jumping jacks and charting their progress. The mean (average) for the class was determined using each student’s information, giving a value of \(40\) jumping jacks (JJs) per minute.
Over \(10\) days, Jym measured how many jumping jacks he can do in one session, and how long it took him to do them. The tables below show his results.
| Day | Number of JJs | Time taken | JJs per minute |
|---|---|---|---|
| \(1\) | \(32\) | \(58\) s | |
| \(2\) | \(32\) | \(57\) s | |
| \(3\) | \(34\) | \(59\) s | |
| \(4\) | \(35\) | \(57\) s | |
| \(5\) | \(40\) | \(1\) min \(2\) s |
| Day | Number of JJs | Time taken | JJs per minute |
|---|---|---|---|
| \(6\) | \(42\) | \(1\) min \(5\) s | |
| \(7\) | \(40\) | \(58\) s | |
| \(8\) | \(45\) | \(1\) min \(2\) s | |
| \(9\) | \(46\) | \(1\) min | |
| \(10\) | \(48\) | \(1\) min |
Complete the tables by finding Jym's JJs per minute for each day, rounding to the nearest decimal.
Calculate the mean of the values you found in (a). How does this mean for Jym compare to the rest of his class?
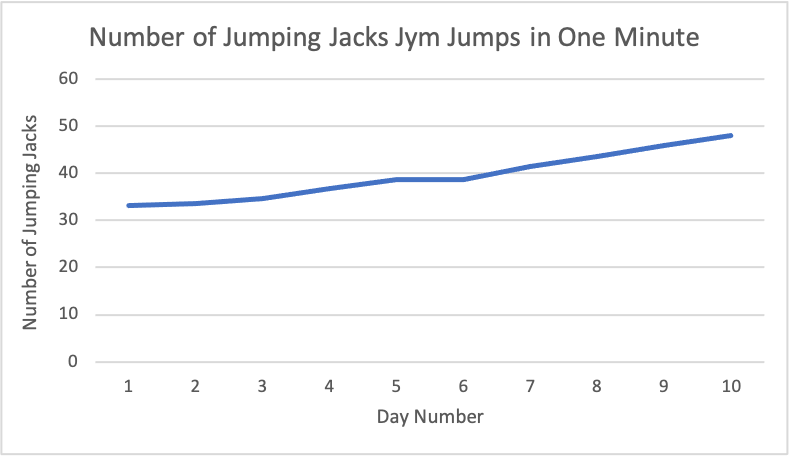
Which type of graph would be most appropriate to show Jym's improvement over time? Create a suitable graph with appropriate labels.
The completed tables are as follows.
| Day | Number of JJs | Time taken | JJs per minute |
|---|---|---|---|
| \(1\) | \(32\) | \(58\) s | \(33.1\) |
| \(2\) | \(32\) | \(57\) s | \(33.7\) |
| \(3\) | \(34\) | \(59\) s | \(34.6\) |
| \(4\) | \(35\) | \(57\) s | \(36.8\) |
| \(5\) | \(40\) | \(1\) min \(2\) s | \(38.7\) |
| Day | Number of JJs | Time taken | JJs per minute |
|---|---|---|---|
| \(6\) | \(42\) | \(1\) min \(5\) s | \(38.8\) |
| \(7\) | \(40\) | \(58\) s | \(41.4\) |
| \(8\) | \(45\) | \(1\) min \(2\) s | \(43.5\) |
| \(9\) | \(46\) | \(1\) min | \(46\) |
| \(10\) | \(48\) | \(1\) min | \(48\) |
Jym’s JJs per minute each day were found by taking his total number of JJs and dividing by the time taken, in seconds, to get the number of JJs per second, and then multiplying this number by \(60\) to get the number of JJs per minute.
For example, on Day \(1\) Jym jumped \(\dfrac{32}{58}\) JJs per second, which is equivalent to \(\dfrac{32}{58} \times 60 \approx 33.1\) JJs per minute.
Jym’s mean JJs per minute is \[\normalsize\frac{33.1 + 33.7 + 34.6 + 36.8 + 38.7 + 38.8 + 41.4 + 43.5 + 46 + 48}{10} = \frac{394.6}{10} = 39.46 \approx 39.5\] Jym’s mean of \(39.5\) JJs per minute is slightly less than the mean for the class.
The most meaningful graph would be one showing Jym’s average JJs per minute versus time, as a broken line graph (or a bar graph). A broken line graph is shown below.