Mohammed wants to graph a record of the traffic that goes by his house between \(4\):\(30\) p.m. and \(4\):\(40\) p.m. He creates a data collection sheet and collects the following data while standing on the sidewalk beside his home during that period.
Time | Vehicle |
---|---|
\(4\):\(30\).\(12\) | Car |
\(4\):\(30\).\(43\) | Car |
\(4\):\(31\).\(24\) | Truck |
\(4\):\(31\).\(58\) | Bicycle |
\(4\):\(32\).\(34\) | Car |
\(4\):\(33\).\(08\) | Car |
Time | Vehicle |
---|---|
\(4\):\(33\).\(37\) | Truck |
\(4\):\(34\).\(21\) | Car |
\(4\):\(34\).\(52\) | Car |
\(4\):\(35\).\(23\) | Car |
\(4\):\(36\).\(14\) | Bicycle |
\(4\):\(36\).\(45\) | Truck |
Time | Vehicle |
---|---|
\(4\):\(37\).\(29\) | Car |
\(4\):\(38\).\(36\) | Bicycle |
\(4\):\(39\).\(16\) | Truck |
\(4\):\(39\).\(48\) | Car |
\(4\):\(40\).\(10\) | Car |
\(4\):\(40\).\(38\) | Car |
Is the data Mohammed collected primary or secondary data?
What type of graph or plot would be appropriate to display this data?
Create this graph or plot using proper titles and labels.
The data Mohammed collected is primary since he collected it. (If he gave the data to city planners to use, then it would be secondary data to them, as they did not collect it themselves.)
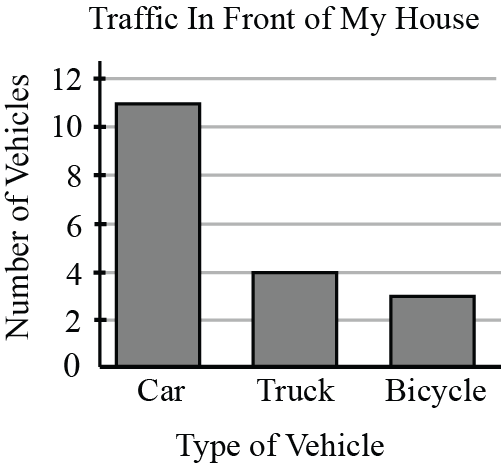
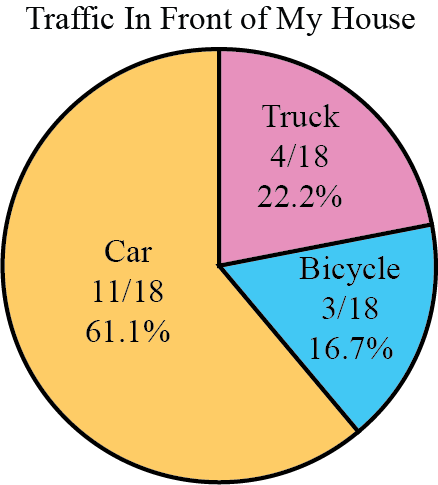
The appropriate type of graph or plot depends on its purpose. Some ideas include a stem-and-leaf plot for minutes and seconds which displays when each vehicle passed, or a bar graph or circle graph to contrast the numbers or ratios of cars, trucks, and bicycles.
Examples of a stem-and-leaf plot, a bar graph, and a circle graph are shown below.
Stem | Leaf |
---|---|
\(4\):\(30\) | \(~12\) \(~43~\) |
\(4\):\(31\) | \(~24\) \(~58~\) |
\(4\):\(32\) | \(~34~\) |
\(4\):\(33\) | \(~08\) \(~37~\) |
\(4\):\(34\) | \(~21\) \(~42~\) |
\(4\):\(35\) | \(~23~\) |
\(4\):\(36\) | \(~14\) \(~45~\) |
\(4\):\(37\) | \(~29~\) |
\(4\):\(38\) | \(~36~\) |
\(4\):\(39\) | \(~16\) \(~48~\) |
\(4\):\(40\) | \(~10\) \(~38~\) |
Key: \(4\):\(40\) \(\vert\) \(10\) \(=\) \(4\):\(40\).\(10\) p.m.